PRODUCTION POSSIBILITY CURVE
The economy has to choose between alternative combinations of various goods and services. This problem of choice can be illustrated by a simple graph known as Production Possibility Curve or a Product Transformation Curve. A typical Production Possibility Curve (PPC) is drawn on the following assumptions:
i) The country has to choose between alternative combinations of only two goods, say. LED (L) and computer monitor (M).
ii) All productive resources of the country are taken as given and so is the state of technology, no changes are made in them.
iii) All productive resources of the economy are fully employed. There is no wastage or under utilisation.
iv) The productive resources are suitable for the production of both goods (L) and (M). They can, therefore, be shifted from the production of one to the other goods. However, such a shift would reduce the production of the first good and increase that of the other.
v) No factor of production is considered to be specific in the production of one good alone and inappropriate for the production of the other.
vi) We consider the productive efficiency of the productive resources only in physical terms, i.e., the units of LED (L) and Computer Monitor which they can produce.
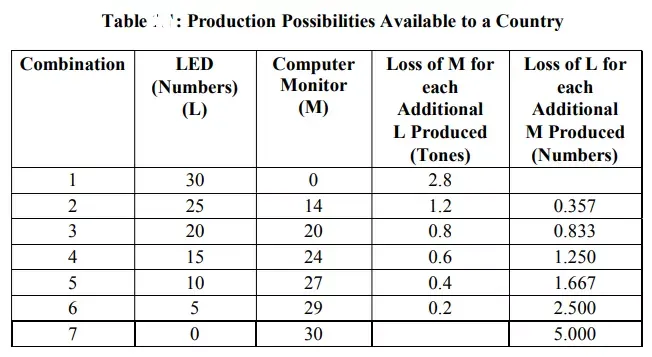
Based upon these assumptions, we can illustrate the set of production possibilities available to a country by a hypothetical example. Look at Table 1.1. The figures in the table show that all the productive resources of the country put together can produce a maximum of either 30 L or 30 M or some other combinations thereof. The production possibilities illustrated in Table 1.1 are also represented in Fig. in the form of a production possibility curve (PPC).
Quantity of M is measured along X-axis and the numbers of L are measured along Y-axis. The respective pairs of the quantities of L and M are plotted and joined with each other to yield a curve which is called the Production Possibility Curve. Thus, the PPC represents all the possible combinations of L and M which can be produced by using all the productive resources of the economy, efficiently. In that sense, each point on the curve represents the maximum possible output and, for that reason, it is also termed as the production frontier of the economy.
The economy can produce any combination of L and M represented by a point either on the PPC or in the shaded area of the diagram. Production combinations represented by the shaded area imply that the economy can produce either L or M or both. For example, combinations represented by points A, B and C are feasible, as these lie either on the PPC or in the shaded area. But the combination represented by A is feasible but not efficient. Combination represented by points B and C are both feasible and efficient. If it produces at Point A it is not utilising some of its productive resources and let them go waste. Thus consider point A which represents a combination of 10 tonnes of M and 14 L. The PPC, however, shows that with this much of M, the economy can produce 27 L (as shown by point C on PPC). Alternatively, with 14 L, the quantity of M can be increased to 25 tonnes (see point B).
Any point beyond the PPC, which is in the non-shaded area of the diagram, shows a combination of L and M which the economy cannot produce. For example, point D represents a combination of 30 M and 20 L. However, when 30 M is produced, no resources are left for the production of L. On the other hand, if 20 L are produced, then the quantity of M has to be reduced to 20.
Subscribe on YouTube - NotesWorld
For PDF copy of Solved Assignment
Any University Assignment Solution


.webp)