
Standard
Deviation: Explanation & Calculations of Ungrouped Data
Standard deviation is an important tool in statistical
analysis as it provides a measure of the doubt or risk affiliated with a
dataset. It allows you to understand the range that contains most data points that
is especially useful when working with large data sets.
The standard deviation is represented as “STDEV” or
“SD” and is used in statistics to assess the reliability of sample estimates
and to compare different data sets. By considering the STDEV, we can assess the
consistency and reliability of the data, allowing us to make more accurate
predictions and give more absolute conclusions.
With this post, we are going to cover the idea of standard deviation in statistics. We will learn how we can calculate if we have data in ungrouped form and teach its different types. Also, we’ll simplify an example to help our readers that can easily understand this concept.

What Is
Standard Deviation?
A
statistical measuring tool used to determine the variability or dispersion of a
dataset from the average value is said to be the standard deviation (SD). The
standard deviation is often represented by “σ” sigma or alphabet s.
The
small value of SD shows that the data
values are closer to the average value (Mean), and on the other hand, we have
an inverse statement that the larger value indicates the data values are more
spread from the average value (Mean).
We
can determine the standard deviation by two different methods said to its
types.
Population
STDEV (σ):
Normally,
we use the population standard deviation when we need to find the standard
deviation of any individual dataset. To evaluate the population standard
deviation for discrete ungrouped data we use the formula:
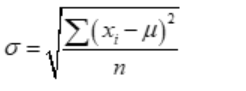
Where
μ is the average value of the population data, xi is the individual
data values, and N shows the number of observations.
Sample STDEV
(s):
For
calculating the sample standard deviation for discrete ungrouped data, we use
the formula:

where
x̅ is the average value of the sample data, xi is the individual
data values, and N shows the number of observations that can also be said as
the degree of freedom (n – 1).
How to Find
Out Standard Deviation of Ungrouped Data?
The
standard deviation of ungrouped data is a statistical measure that determines
the amount of variation or dispersion in a set of individual data points. It
provides valuable insights into the spread of the data and helps in
understanding the overall distribution.
Let's suppose we need to find the standard deviation (sample and population) of the ungrouped dataset then we obey the following instructions as same as it is:
- Identify, what is the No. of observations N.
- Summing all data values Σx.
- Calculate the average point value for both (population & and sample) is the same as Σx /N.
- Squaring the differences of every data value from the generated average point value. (xi – x̅)2.
- Adding squared differences and finding the total of them Σ(xi – x̅)2.
- For the population dataset, we divide the total of the squared differences by the number of observations. The generated term is equivalent to the variance of the dataset.
o σ2 = Σ(xi – x̅)2 /N
o σ2 = Σ(d2) /N [where d = (xi – x̅)]
- For the sample data, we divide the sum of the squared
difference by 1 less than the number of observations.
o s2 = Σ(xi – x̅)2 /N – 1
o s2 = Σ(d2) /N – 1 [where d = (xi – x̅)]
- End up by taking the square root of the variance.
o σ = √ [Σ(xi – x̅)2 /N] or √
[Σ(d)2
/N] [where d = (xi – x̅)]
o s = √ [Σ(xi – x̅)2 /N – 1] or √ [Σ(d)2 /N – 1] [where d = (xi –
x̅)]
Examples
Q#1:
The revenue collection by the National Accountability Bureau from 10 corrupt
officers is as follows:
12M,
3M, 5M, 4M, 8M, 15M, 6M, 9M, 20M, 10M. What is it sample standard deviation?
Solution:
| No. of person | xi | xi – x̅ | (xi – x̅)2 |
|---|---|---|---|
| 1 | 12 | 2.8 | 7.84 |
| 2 | 3 | -6.2 | 38.44 |
| 3 | 5 | -4.2 | 17.64 |
| 4 | 4 | -5.2 | 27.04 |
| 5 | 8 | -1.2 | 1.44 |
| 6 | 15 | 5.8 | 33.64 |
| 7 | 6 | -3.2 | 10.24 |
| 8 | 9 | -0.2 | 0.04 |
| 9 | 20 | 10.8 | 116.64 |
| 10 | 10 | 0.8 | 0.64 |
| N = 10 | Σ(x) = 92 | -- | Σ (xi - x)2 = 253.6 |
1 –
N = 10
2 –
Σx = 92
3 –
Mean value.
x̅ = 92/10 = 9.2
4 –
Total of the deviations from the mean value.
Σ (xi – x̅)2 = 253.6
5 –
Variance.
s2 = Σ(xi – x̅)2
/N – 1 = 253.6/9
s2 = 28.18
6 –
Standard Deviation.
s = √28.18 = 5.3
The
standard deviation of the collection = 5.3 million
Q#2:
Evaluate the Mean, Var, and STDEV of the following population data.
10,
14, 18, 22, 26, 30.
Solution:
Given
xi = 10, 14, 18, 22, 26, 30
N
= 6
Popu. Mean = μ = (10 + 14 + 18 + 22 + 26 + 30) /6 = 120/6 = 20
We
know that the variance = σ2 = Σ(xi – x̅)2 /N
Σ(xi – x̅)2
= [(10-20) + (14-20) + (18-20) + (22-20) + (26-20) + (30-20)]2
=
[– 10 – 6 – 2 + 2 + 6 + 10]2 = [100 + 36 + 4 + 4 + 36 + 100]
Σ(xi – x̅)2
= 280
σ2
= Σ(xi – x̅)2 /N =
280/6
σ2
= 46.6667
Standard deviation (STDEV).
σ
= √46.6667
σ
= 6.831
Wrap Up
Finally,
understanding the standard deviation is critical to assessing the variability
and reliability of data. Whether using the population or sample standard
deviation, the calculation process involves determining the mean, finding the
squared variance, and finally obtaining a measure that represents the spread of
the data.
Subscribe on YouTube - NotesWorld
For PDF copy of Solved Assignment
Any University Assignment Solution
.webp)